Balloting
Simple trig
Logistic map
The Attractor of Henon
Number doubling
Barnsley's Fern
The Sierpinski Triangle
Analysis of the 2000 Florida presidential balloting with program code and graphical output by Roger Luebeck © 2000, 2017 |
|
home Balloting Simple trig Logistic map The Attractor of Henon Number doubling Barnsley's Fern The Sierpinski Triangle |
|
|
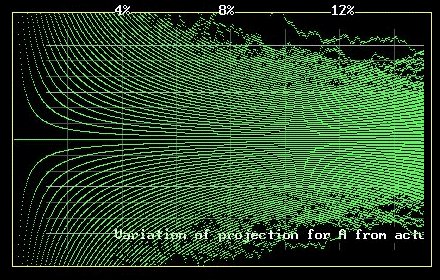
Balloting Includes commentary on the media, the Supreme Court and lawyers. This iterated balloting algorithm, using a random number generator, generated surprising patterns amidst chaos. I developed this algorithm in November 2000 as part of a DOS program I wrote to simulate the Florida presidential balloting, in order to predict who would win the recount - Bush or Gore. Undervoting (not voting for either candidate) occurs at a very consistent rate -- in a geographic, historical and voting machine-type sense. It is about 1.2 percent; i.e., about 1.2 percent of voters at a polling location choose to not vote for either presidential candidate. My DOS program predicted that if a standard for counting ballots was adopted that produced agreement in undervote between "Marksense" counties and "Optical" counties, then Gore would have an 80 percent chance of winning, with the most likely margin of victory being approximately 350 votes. (I had requested undervote data from all 67 Florida counties and promptly received the data from all but two small counties.) One year later such a recount was performed and Gore actually won by more than 100 votes, using the standard whereby "[pin] pricks" (dimples) counted as votes, and therefore could also create an "overvote" (which is a throw-away). There was never anything to even think about. It was the only standard that ever made any sense: [Pin] pricks can't appear without the voter pulling the lever, as emphasized by the president of the company that manufactured the Marksense machines, and as verified by their own testing. All other standards for interpreting ballots produced results that fantastically failed to bring the undervote data in Marksense counties into agreement with Optical counties. In fact, all other standards were absurd on face value, without even considering the extreme undervote aberration. footnote: As intimated above, a few standards other than the sole rational standard were incorporated into studies in the months following the election. The absurdly irrational standards had Bush winning. Thus, the consensus among the media is that Bush must indeed have been the legitimate winner. Do I need to explain? There were about four irrational standards (Bush winning in each case) and only one rational standard (which had Gore winning). Well, as brilliant minds know.. truth is determined by majority, regardless of the characteristics of the majority, and it was four to one. The U.S. Supreme Court had ordered the manner in which the official recount was to proceed. I listened to their presentation on the radio. All nine justices were cluelessly out of their element, thought themselves brilliant, and were then fawned over by the media. Prior to that, Gore's barefoot lawyer was fawned over by the media. He had been unwittingly arguing for a standard that was both incorrect and would have mathematically eliminated his client. I was the only person aware of that fact. There are people who, after the study showed Gore to be the winner, said that they knew it all along. They did not. Anyhow.... Even though my program incorporated the BASIC random number generator, distinct patterns always appeared in the graphical output. This is an example of applying an algorithm to randomness. Without the algorithm, no number of iterations of XY plots, with Y being assigned randomly, will produce any pattern. The pattern that is generated matches that which is generated by three other very different algorithms: logistic map a repeating line drawing routine used to color a plane in a CAD program simple trig They are shown on other pages of this website. (VisualBASIC and DOS BASIC program code is displayed further down on page) The following graphs were generated using a slightly modified version of the DOS program using VisualBASIC: |
Output: First 20 percent Amplitude: .5 X increment: .04 Votes: 20000 Trials: 500 |
 Output: First 50 percent
Amplitude: .5
X increment: .04
Votes: 20000
Trials: 500
Output: First 50 percent
Amplitude: .5
X increment: .04
Votes: 20000
Trials: 500
 Output: First 80 percent
Amplitude: .5
X increment: .04
Votes: 20000
Trials: 500
Output: First 80 percent
Amplitude: .5
X increment: .04
Votes: 20000
Trials: 500
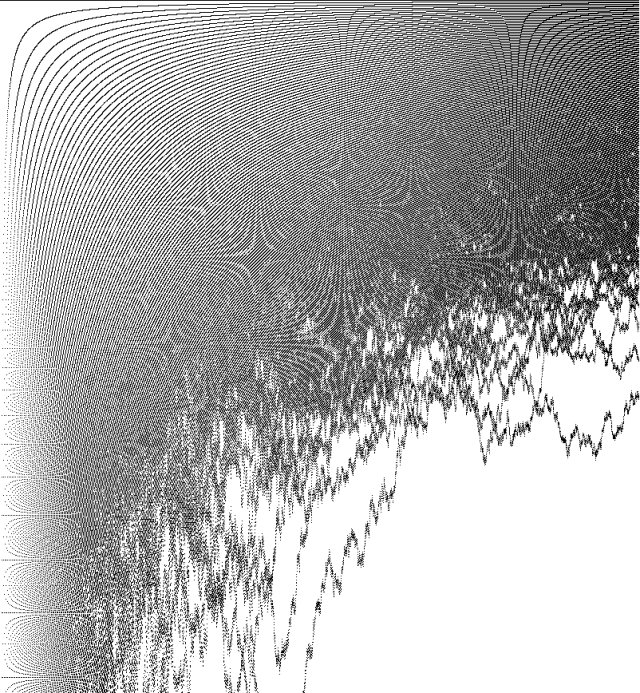
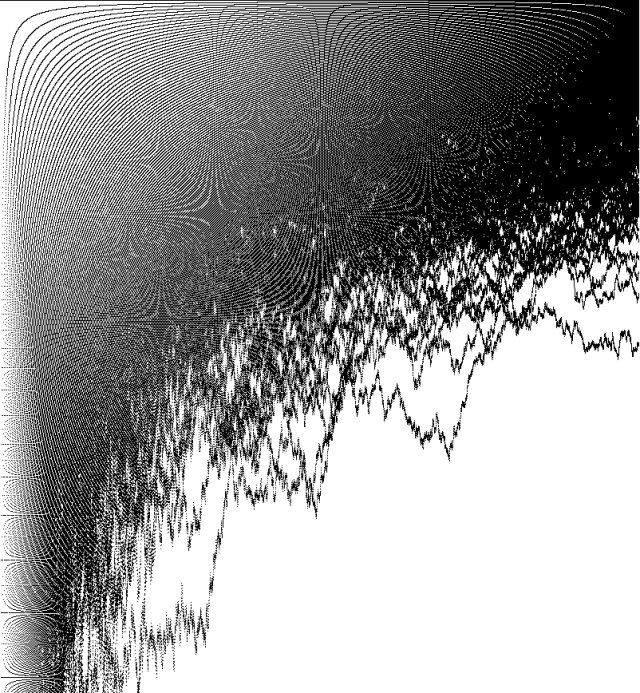 More amazement: When I shrunk the images, even more
accentuated and previously undetected patterns appeared.
The greater the shrinkage, the more revealing are the
newly seen patterns. The following three images are
1/2 size, 1/4 size and 1/6 size (then re-enlarged) of
the "50 percent" image:
Output: First 50 percent
Amplitude: .5
X increment: .04
Votes: 20000
Trials: 500
More amazement: When I shrunk the images, even more
accentuated and previously undetected patterns appeared.
The greater the shrinkage, the more revealing are the
newly seen patterns. The following three images are
1/2 size, 1/4 size and 1/6 size (then re-enlarged) of
the "50 percent" image:
Output: First 50 percent
Amplitude: .5
X increment: .04
Votes: 20000
Trials: 500
 Strangely enough, I discovered this identical pattern
when I graphed the logistic difference equation in a
circular manner for a given value of the parameter r.
Those images are displayed on the logistic difference
equation page of this website.
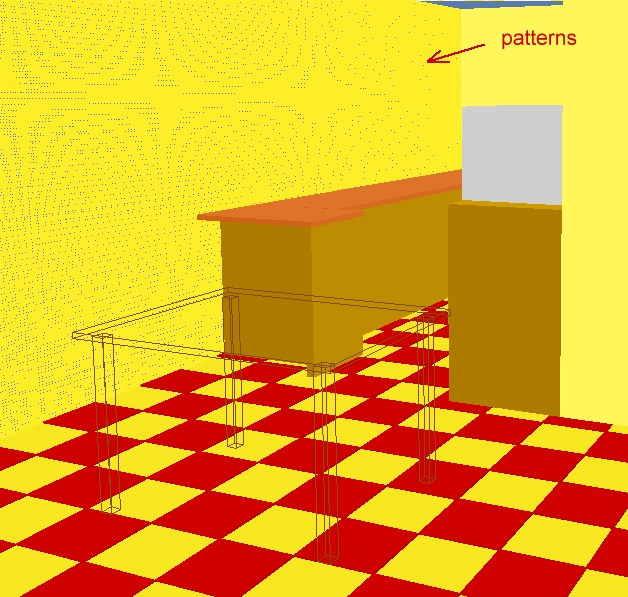
Just as surprising, this very same pattern showed up on
one of my 3D-CAD images, due to some odd combination of
perspective angle and the ratio of cross-hatch lines used
to color a plane. I've never seen that pattern or any
other pattern appearing on any of my thousands of CAD
images. Here it is:
Strangely enough, I discovered this identical pattern
when I graphed the logistic difference equation in a
circular manner for a given value of the parameter r.
Those images are displayed on the logistic difference
equation page of this website.
Just as surprising, this very same pattern showed up on
one of my 3D-CAD images, due to some odd combination of
perspective angle and the ratio of cross-hatch lines used
to color a plane. I've never seen that pattern or any
other pattern appearing on any of my thousands of CAD
images. Here it is:
 Here is an image from my original DOS BASIC program, which
I used to determine the margin of error in my prediction:
Here is an image from my original DOS BASIC program, which
I used to determine the margin of error in my prediction:
 By varying the scale and the percent of output, one can
adjust the manner in which the patterns appear:
By varying the scale and the percent of output, one can
adjust the manner in which the patterns appear:
 Shrinking the above image gradually revealed some
grouping of the Y values. See next two images:
Shrinking the above image gradually revealed some
grouping of the Y values. See next two images:
 Here is the computational portion of my program code
for the original voting algorithm in QuickBASIC for DOS:
TT = T
TPER = INT(TT * PER / 100)
TINC = INT(TPER / 1000)
FOR VOTE = 1 TO TRI
RANDOMIZE TIMER
LOCATE 12, 5: PRINT "Number of trials :"; VOTE
50 B = 0: G = 0: C = 0: X = 0
INCRE = 0: ACT = 0: VARIA = 0
BP = TT / 2: GP = TT / 2
FOR C = 1 TO TPER
V1 = RND(1)
IF V1 < .5 THEN B = B + 1
IF V1 >= .5 THEN G = G + 1
ACT = ACT + 1
A = ACT / 2
100 INCRE = INCRE + 1
IF INCRE = TINC THEN
INCRE = 0
COLOR 10
VARIA = INT((A - G) * (TT / ACT))
X = X + 1
PSET (X, VARIA / S)
END IF
150 :
NEXT C
T = TT
NEXT VOTE
200 I$ = INKEY$
IF I$ = "" THEN 200
=========================================================
Here is my complete program code for the original
voting algorithm in QuickBASIC for DOS:
SCREEN 12
CLEAR
CLS
KEY(10) ON
ON KEY(10) GOSUB 300
5 :
VIEW (1, 1)-(639, 218)
CLS
KEY(9) ON
ON KEY(9) GOSUB 400
COLOR 14
LOCATE 28, 5: PRINT "Exit - F10"
COLOR 13
LOCATE 20, 46: PRINT "Current total ballots: "; TT
LOCATE 22, 46: PRINT "Current scale: "; S
LOCATE 24, 46: PRINT "Current percent: "; PER
COLOR 11
LOCATE 20, 3: INPUT "Input total ballots"; T
LOCATE 22, 3: INPUT "Scale (multiple of 1.5)"; S
6 LOCATE 24, 3: INPUT "Percent used for final
projection"; PER
IF PER = 10 OR PER = 20 OR PER = 40
OR PER = 80 OR PER = 99 THEN 7
LOCATE 22, 20: PRINT " ": GOTO 6
7 LOCATE 26, 3: INPUT "Number of trials"; TRI
VIEW (1, 1)-(639, 479)
CLS
TT = T
TPER = INT(TT * PER / 100)
TINC = INT(TPER / 1000)
YSCALE = TT / 750
VIEW (2, 218)-(600, 470), , 14
WINDOW (0, -YSCALE)-(1100, YSCALE)
COL = 1
ROW = 7
COLOR 13
LOCATE 1, 1: PRINT "Start - press spacebar"
LOCATE 2, 1: PRINT "Exit - F10 Restart - F9"
COLOR 14
LOCATE 1, 34: PRINT "Total ballots: "; TT
LOCATE 2, 34: PRINT "Scale: "; S
LOCATE 3, 34: PRINT "Trials to run: "; TRI
YLINE = INT(.9 * YSCALE)
COLOR 8
LINE (100, YLINE)-(100, -YLINE)
LINE (200, YLINE)-(200, -YLINE)
LINE (300, YLINE)-(300, -YLINE)
LINE (400, YLINE)-(400, -YLINE)
LINE (500, YLINE)-(500, -YLINE)
LINE (600, YLINE)-(600, -YLINE)
LINE (700, YLINE)-(700, -YLINE)
LINE (800, YLINE)-(800, -YLINE)
LINE (900, YLINE)-(900, -YLINE)
LINE (990, YLINE)-(990, -YLINE)
L6 = INT(.75 * YSCALE)
L5 = INT(.625 * YSCALE)
L4 = INT(.5 * YSCALE)
L3 = INT(.375 * YSCALE)
L2 = INT(.25 * YSCALE)
L1 = INT(.125 * YSCALE)
COLOR 7
LINE (60, L6)-(990, L6)
COLOR 8
LINE (60, L5)-(990, L5)
LINE (60, L4)-(990, L4)
COLOR 7
LINE (60, L3)-(990, L3)
COLOR 8
LINE (60, L2)-(990, L2)
LINE (60, L1)-(990, L1)
COLOR 7
LINE (60, 0)-(990, 0)
COLOR 8
LINE (60, -L1)-(990, -L1)
LINE (60, -L2)-(990, -L2)
COLOR 7
LINE (60, -L3)-(990, -L3)
COLOR 8
LINE (60, -L4)-(990, -L4)
LINE (60, -L5)-(990, -L5)
COLOR 7
LINE (60, -L6)-(990, -L6)
LOCATE 16, 67: PRINT INT(S * TT / 1000); (.1) * (S)
LOCATE 19, 67: PRINT INT(S * TT / 2000); (.05) * (S)
LOCATE 22, 67: PRINT " 0"
LOCATE 25, 67: PRINT INT(S * TT / 2000); (.05) * (S)
LOCATE 28, 67: PRINT INT(S * TT / 1000); (.1) * (S)
COLOR 15
LOCATE 28, 14: PRINT "Variation of
projection for A from actual A"
COLOR 15
IF PER = 10 THEN 11
IF PER = 20 THEN 12
IF PER = 40 THEN 14
IF PER = 80 THEN 18
IF PER = 99 THEN 20
11 LOCATE 14, 14: PRINT "2%"
LOCATE 14, 27: PRINT "4%"
LOCATE 14, 41: PRINT "6%"
LOCATE 14, 54: PRINT "8%"
LOCATE 14, 68: PRINT "10%"
GOTO 30
12 LOCATE 14, 14: PRINT "4%"
LOCATE 14, 27: PRINT "8%"
LOCATE 14, 41: PRINT "12%"
LOCATE 14, 54: PRINT "16%"
LOCATE 14, 68: PRINT "20%"
GOTO 30
14 LOCATE 14, 14: PRINT "8%"
LOCATE 14, 27: PRINT "16%"
LOCATE 14, 41: PRINT "24%"
LOCATE 14, 54: PRINT "32%"
LOCATE 14, 68: PRINT "40%"
GOTO 30
18 LOCATE 14, 14: PRINT "16%"
LOCATE 14, 27: PRINT "32%"
LOCATE 14, 41: PRINT "48%"
LOCATE 14, 54: PRINT "64%"
LOCATE 14, 68: PRINT "80%"
GOTO 30
20 LOCATE 14, 14: PRINT "20%"
LOCATE 14, 27: PRINT "40%"
LOCATE 14, 41: PRINT "60%"
LOCATE 14, 54: PRINT "80%"
LOCATE 14, 68: PRINT "99%"
30 :
COLOR 13
LOCATE 13, 2: PRINT "Press spacebar to continue"
40 I$ = INKEY$
IF I$ = "" THEN 40
LOCATE 13, 2: PRINT " "
FOR VOTE = 1 TO TRI
RANDOMIZE TIMER
LOCATE 12, 5: PRINT "Number of trials :"; VOTE
50 B = 0: G = 0: C = 0: X = 0
INCRE = 0: ACT = 0: VARIA = 0
BP = TT / 2: GP = TT / 2
FOR C = 1 TO TPER
V1 = RND(1)
IF V1 < .5 THEN B = B + 1
IF V1 >= .5 THEN G = G + 1
ACT = ACT + 1
A = ACT / 2
100 INCRE = INCRE + 1
IF INCRE = TINC THEN
INCRE = 0
COLOR 10
VARIA = INT((A - G) * (TT / ACT))
X = X + 1
PSET (X, VARIA / S)
END IF
150 :
NEXT C
T = TT
NEXT VOTE
200 I$ = INKEY$
IF I$ = "" THEN 200
COLOR 12
LINE (100, YLINE)-(100, -YLINE)
LINE (200, YLINE)-(200, -YLINE)
LINE (300, YLINE)-(300, -YLINE)
LINE (400, YLINE)-(400, -YLINE)
LINE (500, YLINE)-(500, -YLINE)
LINE (600, YLINE)-(600, -YLINE)
LINE (700, YLINE)-(700, -YLINE)
LINE (800, YLINE)-(800, -YLINE)
LINE (900, YLINE)-(900, -YLINE)
LINE (990, YLINE)-(990, -YLINE)
COLOR 12
LINE (60, L6)-(990, L6)
COLOR 12
LINE (60, L5)-(990, L5)
LINE (60, L4)-(990, L4)
COLOR 12
LINE (60, L3)-(990, L3)
COLOR 12
LINE (60, L2)-(990, L2)
LINE (60, L1)-(990, L1)
COLOR 12
LINE (60, 0)-(990, 0)
COLOR 12
LINE (60, -L1)-(990, -L1)
LINE (60, -L2)-(990, -L2)
COLOR 12
LINE (60, -L3)-(990, -L3)
COLOR 12
LINE (60, -L4)-(990, -L4)
LINE (60, -L5)-(990, -L5)
COLOR 12
LINE (60, -L6)-(990, -L6)
250 I$ = INKEY$
IF I$ = "" THEN 250
GOTO 5
300 KEY(10) OFF: KEY(9) OFF
END
400 KEY(9) OFF: GOTO 5
=================================================
Here is my original code for the VisualBASIC version.
Private Sub voterunbtn_Click()
Set viewport.Picture = LoadPicture("")
DONE$ = "done"
per = Val(perbox.Text)
amp = Val(ampbox.Text)
inc = Val(incbox.Text)
iter = Val(iterbox.Text)
trials = Val(trialsbox.Text)
iterper = Int(iter * (per / 100))
For total = 1 To trials
Randomize Timer
X = 0: G = 0: A = 0
For C = 1 To iterper
RN = Rnd(1)
If RN >= 0.5 Then G = G + 1
A = A + 1
A2 = A / 2
Y = (A2 - G) * (iter / A)
X = X + ((100 * inc) / per)
viewport.PSet (X, Y / amp), RGB(0, 0, 0)
Next C
Next total
finalnum.Text = DONE$
End Sub
=================================================
Here is the computational portion of my program code
for the original voting algorithm in QuickBASIC for DOS:
TT = T
TPER = INT(TT * PER / 100)
TINC = INT(TPER / 1000)
FOR VOTE = 1 TO TRI
RANDOMIZE TIMER
LOCATE 12, 5: PRINT "Number of trials :"; VOTE
50 B = 0: G = 0: C = 0: X = 0
INCRE = 0: ACT = 0: VARIA = 0
BP = TT / 2: GP = TT / 2
FOR C = 1 TO TPER
V1 = RND(1)
IF V1 < .5 THEN B = B + 1
IF V1 >= .5 THEN G = G + 1
ACT = ACT + 1
A = ACT / 2
100 INCRE = INCRE + 1
IF INCRE = TINC THEN
INCRE = 0
COLOR 10
VARIA = INT((A - G) * (TT / ACT))
X = X + 1
PSET (X, VARIA / S)
END IF
150 :
NEXT C
T = TT
NEXT VOTE
200 I$ = INKEY$
IF I$ = "" THEN 200
=========================================================
Here is my complete program code for the original
voting algorithm in QuickBASIC for DOS:
SCREEN 12
CLEAR
CLS
KEY(10) ON
ON KEY(10) GOSUB 300
5 :
VIEW (1, 1)-(639, 218)
CLS
KEY(9) ON
ON KEY(9) GOSUB 400
COLOR 14
LOCATE 28, 5: PRINT "Exit - F10"
COLOR 13
LOCATE 20, 46: PRINT "Current total ballots: "; TT
LOCATE 22, 46: PRINT "Current scale: "; S
LOCATE 24, 46: PRINT "Current percent: "; PER
COLOR 11
LOCATE 20, 3: INPUT "Input total ballots"; T
LOCATE 22, 3: INPUT "Scale (multiple of 1.5)"; S
6 LOCATE 24, 3: INPUT "Percent used for final
projection"; PER
IF PER = 10 OR PER = 20 OR PER = 40
OR PER = 80 OR PER = 99 THEN 7
LOCATE 22, 20: PRINT " ": GOTO 6
7 LOCATE 26, 3: INPUT "Number of trials"; TRI
VIEW (1, 1)-(639, 479)
CLS
TT = T
TPER = INT(TT * PER / 100)
TINC = INT(TPER / 1000)
YSCALE = TT / 750
VIEW (2, 218)-(600, 470), , 14
WINDOW (0, -YSCALE)-(1100, YSCALE)
COL = 1
ROW = 7
COLOR 13
LOCATE 1, 1: PRINT "Start - press spacebar"
LOCATE 2, 1: PRINT "Exit - F10 Restart - F9"
COLOR 14
LOCATE 1, 34: PRINT "Total ballots: "; TT
LOCATE 2, 34: PRINT "Scale: "; S
LOCATE 3, 34: PRINT "Trials to run: "; TRI
YLINE = INT(.9 * YSCALE)
COLOR 8
LINE (100, YLINE)-(100, -YLINE)
LINE (200, YLINE)-(200, -YLINE)
LINE (300, YLINE)-(300, -YLINE)
LINE (400, YLINE)-(400, -YLINE)
LINE (500, YLINE)-(500, -YLINE)
LINE (600, YLINE)-(600, -YLINE)
LINE (700, YLINE)-(700, -YLINE)
LINE (800, YLINE)-(800, -YLINE)
LINE (900, YLINE)-(900, -YLINE)
LINE (990, YLINE)-(990, -YLINE)
L6 = INT(.75 * YSCALE)
L5 = INT(.625 * YSCALE)
L4 = INT(.5 * YSCALE)
L3 = INT(.375 * YSCALE)
L2 = INT(.25 * YSCALE)
L1 = INT(.125 * YSCALE)
COLOR 7
LINE (60, L6)-(990, L6)
COLOR 8
LINE (60, L5)-(990, L5)
LINE (60, L4)-(990, L4)
COLOR 7
LINE (60, L3)-(990, L3)
COLOR 8
LINE (60, L2)-(990, L2)
LINE (60, L1)-(990, L1)
COLOR 7
LINE (60, 0)-(990, 0)
COLOR 8
LINE (60, -L1)-(990, -L1)
LINE (60, -L2)-(990, -L2)
COLOR 7
LINE (60, -L3)-(990, -L3)
COLOR 8
LINE (60, -L4)-(990, -L4)
LINE (60, -L5)-(990, -L5)
COLOR 7
LINE (60, -L6)-(990, -L6)
LOCATE 16, 67: PRINT INT(S * TT / 1000); (.1) * (S)
LOCATE 19, 67: PRINT INT(S * TT / 2000); (.05) * (S)
LOCATE 22, 67: PRINT " 0"
LOCATE 25, 67: PRINT INT(S * TT / 2000); (.05) * (S)
LOCATE 28, 67: PRINT INT(S * TT / 1000); (.1) * (S)
COLOR 15
LOCATE 28, 14: PRINT "Variation of
projection for A from actual A"
COLOR 15
IF PER = 10 THEN 11
IF PER = 20 THEN 12
IF PER = 40 THEN 14
IF PER = 80 THEN 18
IF PER = 99 THEN 20
11 LOCATE 14, 14: PRINT "2%"
LOCATE 14, 27: PRINT "4%"
LOCATE 14, 41: PRINT "6%"
LOCATE 14, 54: PRINT "8%"
LOCATE 14, 68: PRINT "10%"
GOTO 30
12 LOCATE 14, 14: PRINT "4%"
LOCATE 14, 27: PRINT "8%"
LOCATE 14, 41: PRINT "12%"
LOCATE 14, 54: PRINT "16%"
LOCATE 14, 68: PRINT "20%"
GOTO 30
14 LOCATE 14, 14: PRINT "8%"
LOCATE 14, 27: PRINT "16%"
LOCATE 14, 41: PRINT "24%"
LOCATE 14, 54: PRINT "32%"
LOCATE 14, 68: PRINT "40%"
GOTO 30
18 LOCATE 14, 14: PRINT "16%"
LOCATE 14, 27: PRINT "32%"
LOCATE 14, 41: PRINT "48%"
LOCATE 14, 54: PRINT "64%"
LOCATE 14, 68: PRINT "80%"
GOTO 30
20 LOCATE 14, 14: PRINT "20%"
LOCATE 14, 27: PRINT "40%"
LOCATE 14, 41: PRINT "60%"
LOCATE 14, 54: PRINT "80%"
LOCATE 14, 68: PRINT "99%"
30 :
COLOR 13
LOCATE 13, 2: PRINT "Press spacebar to continue"
40 I$ = INKEY$
IF I$ = "" THEN 40
LOCATE 13, 2: PRINT " "
FOR VOTE = 1 TO TRI
RANDOMIZE TIMER
LOCATE 12, 5: PRINT "Number of trials :"; VOTE
50 B = 0: G = 0: C = 0: X = 0
INCRE = 0: ACT = 0: VARIA = 0
BP = TT / 2: GP = TT / 2
FOR C = 1 TO TPER
V1 = RND(1)
IF V1 < .5 THEN B = B + 1
IF V1 >= .5 THEN G = G + 1
ACT = ACT + 1
A = ACT / 2
100 INCRE = INCRE + 1
IF INCRE = TINC THEN
INCRE = 0
COLOR 10
VARIA = INT((A - G) * (TT / ACT))
X = X + 1
PSET (X, VARIA / S)
END IF
150 :
NEXT C
T = TT
NEXT VOTE
200 I$ = INKEY$
IF I$ = "" THEN 200
COLOR 12
LINE (100, YLINE)-(100, -YLINE)
LINE (200, YLINE)-(200, -YLINE)
LINE (300, YLINE)-(300, -YLINE)
LINE (400, YLINE)-(400, -YLINE)
LINE (500, YLINE)-(500, -YLINE)
LINE (600, YLINE)-(600, -YLINE)
LINE (700, YLINE)-(700, -YLINE)
LINE (800, YLINE)-(800, -YLINE)
LINE (900, YLINE)-(900, -YLINE)
LINE (990, YLINE)-(990, -YLINE)
COLOR 12
LINE (60, L6)-(990, L6)
COLOR 12
LINE (60, L5)-(990, L5)
LINE (60, L4)-(990, L4)
COLOR 12
LINE (60, L3)-(990, L3)
COLOR 12
LINE (60, L2)-(990, L2)
LINE (60, L1)-(990, L1)
COLOR 12
LINE (60, 0)-(990, 0)
COLOR 12
LINE (60, -L1)-(990, -L1)
LINE (60, -L2)-(990, -L2)
COLOR 12
LINE (60, -L3)-(990, -L3)
COLOR 12
LINE (60, -L4)-(990, -L4)
LINE (60, -L5)-(990, -L5)
COLOR 12
LINE (60, -L6)-(990, -L6)
250 I$ = INKEY$
IF I$ = "" THEN 250
GOTO 5
300 KEY(10) OFF: KEY(9) OFF
END
400 KEY(9) OFF: GOTO 5
=================================================
Here is my original code for the VisualBASIC version.
Private Sub voterunbtn_Click()
Set viewport.Picture = LoadPicture("")
DONE$ = "done"
per = Val(perbox.Text)
amp = Val(ampbox.Text)
inc = Val(incbox.Text)
iter = Val(iterbox.Text)
trials = Val(trialsbox.Text)
iterper = Int(iter * (per / 100))
For total = 1 To trials
Randomize Timer
X = 0: G = 0: A = 0
For C = 1 To iterper
RN = Rnd(1)
If RN >= 0.5 Then G = G + 1
A = A + 1
A2 = A / 2
Y = (A2 - G) * (iter / A)
X = X + ((100 * inc) / per)
viewport.PSet (X, Y / amp), RGB(0, 0, 0)
Next C
Next total
finalnum.Text = DONE$
End Sub
=================================================