CHAOS equations - graphs - program code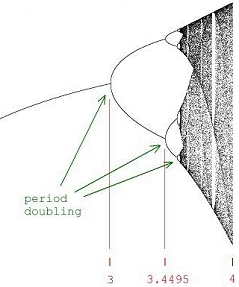
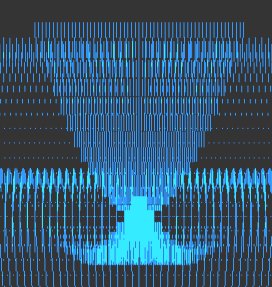
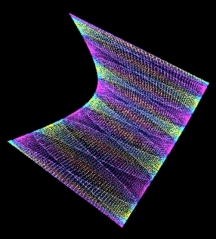
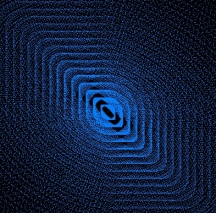
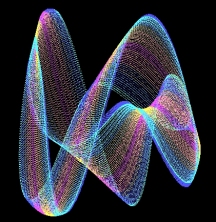
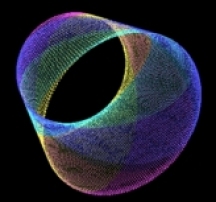
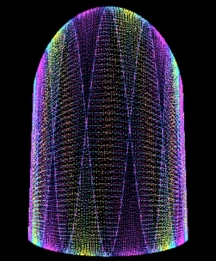
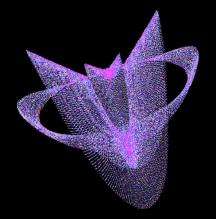
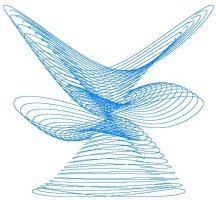
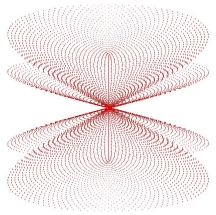
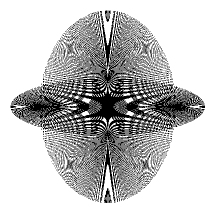
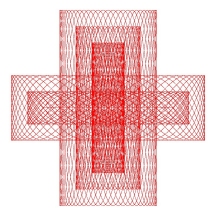
chaos - complexity - order Eight equations generating exotic behavior. Algorithms, program code and graphical output by Roger Luebeck © 2000, 2017 --------------------------------------------------------- The mathematical intrigues on these pages don't rival the sophistication of Mandelboxes and other 3D fractal endeavors which are popular today. If you like the things you see here, and have yet to discover the world of fractals, just do a YouTube search on Mandelboxes. The first two sections below are my creations. The rest of the sections I merely added my investigations to, especially the logistic map. Sections 1, 2, 3 and 4 are by far the most interesting. 1. Balloting Florida 2000 Gore vs. Bush Iteration of a balloting algorithm, using random number generator. It grew out of my analysis of the 2000 Gore - Bush Florida balloting. Surprising patterns amidst chaos. Includes commentary on the media, the Supreme Court and lawyers. 2. Simple trig I played a hunch and came up with a pair of repeating trig equations, with offsetting scalar multipliers for each equation. Unbelievable patterns. (See side panel and click "Simple trig" to see many more.) 3. Logistic map (LM) X = r * X * (1 - X) Mathematician Paul Stein called the complexity of this iterated equation "frightening". Iterating this equation produces regions of distinct values, involving period doubling, as well as regions of chaos. On the LM page, you'll find bifurcation diagrams at various scales showing the depth of this equation. You'll also find the equation graphed parabolically, superimposed onto a straight line graph and the bifurcation diagram. The LRLRR patterning and L:R ratios are examined. Finally, you'll find circular plots of the equation, revealing patterns amidst the chaos. 4. Sine and pi (no link called for) X = r * Sin (pi * X) Here's what my investigations turned up: Profoundly - Iterating this equation generates a bifurcation diagram visually indistinguishable from the one generated by the above logistic map (LM), though the actual values are much different. With LM, the valid values for r range from 0 to 4 and valid values for initial X range from 0 to 1. With the sine pi equation, r can range from 0 to infinity, though there is only chaos beyond r = 57.29578. Initial X can range from 0 to infinity, though the graph flips upside down when initial X exceeds 57.29578. It flips right side up again when initial X is double that value, with the flipping occuring at each multiple of 57.29578, which equals 360/(2 pi). And just as with the LM, one can generate segments of a parabola by plotting X vs previous X.5. The Attractor of Henon X = ((previousY + 1) - (1.4 * previousX ^ 2)) Y = (0.3 * previousX) "Iterating this pair of equations produces a strange simple set of curved lines that is poorly understood by mathematicians. As thousands, then millions of points appear, more and more detail emerges. What appear to be single lines prove, on magnification, to be pairs, then pairs of pairs, and so on to infinity. Whether any two successive points appear nearby or far apart is unpredictable." - James Gleick Called a strange attractor. 6. Number doubling Choose an initial value between 0 and 1. Double it. Drop the integer part. Repeat. Values occur in discreet bunches. Bunches occur in multiples of five, depending on the number of decimal places used. Repeating patterns occur within the bunches. 7. Barnsley's Fern Randomly selected parts of a four part algorithm produces a realistic looking fern. Invented by Michael Barnsley. 8. The Sierpinski Triangle Randomly selected parts of a three part algorithm produces a triangular lattice of triangles. I tried doing this with an orderly, alternating selection of the parts of the algorithm, and got a partial gasket. Also called The Sierpinski Gasket.

Roger Luebeck Updated 03/24/2024 More science and technology from this author: Special relativity in absolute terms A simple 3D CAD system Author's home page is olden-days.me